DATA SCIENCE & ANALYTICS
Data Visualisation & Reporting


Data Visualisation & Reporting
Data Visualisation & Reporting solutions create interactive and intuitive visual representations of data, facilitating easy interpretation and informed decision-making.
Interactive Dashboards
Interactive Dashboards provide dynamic and customisable views of data. Users can interact with the data through filters, drill-downs, and visual elements to gain deeper insights and make informed decisions.
Custom Reporting Solutions
Custom Reporting Solutions create tailored reports to meet specific business needs. This includes designing report templates, automating report generation, and integrating data from various sources for comprehensive analysis.
Data Storytelling Techniques
Data Storytelling Techniques combine data visualisation with narrative elements to convey insights effectively. This approach helps communicate complex data findings in a compelling and understandable way.
Infographic Design
Infographic Design transforms data into visually engaging graphics. This includes creating charts, diagrams, and illustrations to present information clearly and attractively for reports, presentations, and marketing materials.
Real-time Data Visualisation
Real-time Data Visualisation displays data as it is generated, providing immediate insights. This supports applications like operational monitoring, live performance tracking, and instant decision-making.
Data visualisation projects completed.
Data visualisation projects completed.
Client satisfaction rate with our visualisation and reporting services.
Structuring the Data Visualisation & Reporting Process
Our Data Visualisation & Reporting services make complex data accessible and actionable, enabling teams to make informed decisions quickly and confidently.

Data Agregation and Preparation
We gather and prepare data from various sources, structuring it in a way that supports effective visualisation. This process ensures accuracy, completeness, and relevance, providing a reliable foundation for reporting.

Advanced Data Visualisation
We utilise advanced visualisation techniques to present data in intuitive formats, such as charts, graphs, and maps. This approach makes it easy for users to understand complex data patterns and insights.

Dashboard Design and Development
Our team creates custom dashboards tailored to your KPIs and business needs. These interactive dashboards provide real-time insights, enabling stakeholders to track metrics, identify trends, and make data-driven decisions.

Automated Reports and Insights
Automated reporting solutions deliver insights directly to relevant teams, reducing manual effort and ensuring timely information. Customisable reports are available on-demand, supporting ongoing monitoring and strategic planning.
Making Data Accessible for Enhanced Reporting
We cater to various industries with our advanced data visualisation and reporting services, tailored to meet each sector’s unique requirements. Here are some of the key industries we serve:
Finance and Banking
Develop financial reports and visualisations to support strategic decision-making.
Healthcare
Create interactive dashboards to monitor patient outcomes and healthcare operations.
Retail and E-Commerce
Visualise sales data and customer behavior to optimise marketing strategies and operations.
Transportation and Logistics
Create real-time dashboards to track shipments, monitor fleet performance, and improve logistics efficiency.
Education
Develop visual reports to track student performance, academic progress, and institutional metrics.
Let your data-driven insights surpass industry standards.
Tools We Use for Data Science & Analytics
Data science is powered by sophisticated tools that allow us to turn raw data into actionable insights. Our technology stack ensures that your data is not only processed but also interpreted meaningfully.
Structuring the Vision for Data Science & Analytics
Data is the lifeblood of decision-making. We leverage advanced data analytics and intelligence to empower businesses, guiding them to harness the power of their data for strategic advantage.

Crafting Your Data Roadmap
We begin by defining a comprehensive data strategy tailored to your business objectives. This process ensures your data is captured, managed, and utilised effectively, creating a solid foundation for all data initiatives.

Transforming Data into Actionable Insights
Our Business Intelligence (BI) solutions focus on turning complex datasets into clear insights. We build custom dashboards and reports to provide real-time data analytics, helping businesses make informed decisions with confidence.

Ensuring Data Integrity and Security
Effective data management requires governance. We ensure your data is secure, compliant, and integrated across all systems. This process includes defining clear guidelines for how data is handled, stored, and shared.
Our Insights
Our in-depth take on emerging digital trends and technology, offering practical advice to excel in today’s digital economy across various media types.

Debunking the Myths: Low-Code Development
Introduction: Low-Code, High Doubt? Low-Code development platforms are everywhere, from startups launching MVPs in weeks to global enterprises...

Debunking the Myths: Computer Vision
Seeing Is Believing, But Not Always Understanding Computer Vision is everywhere, from facial recognition and medical diagnostics to factory...
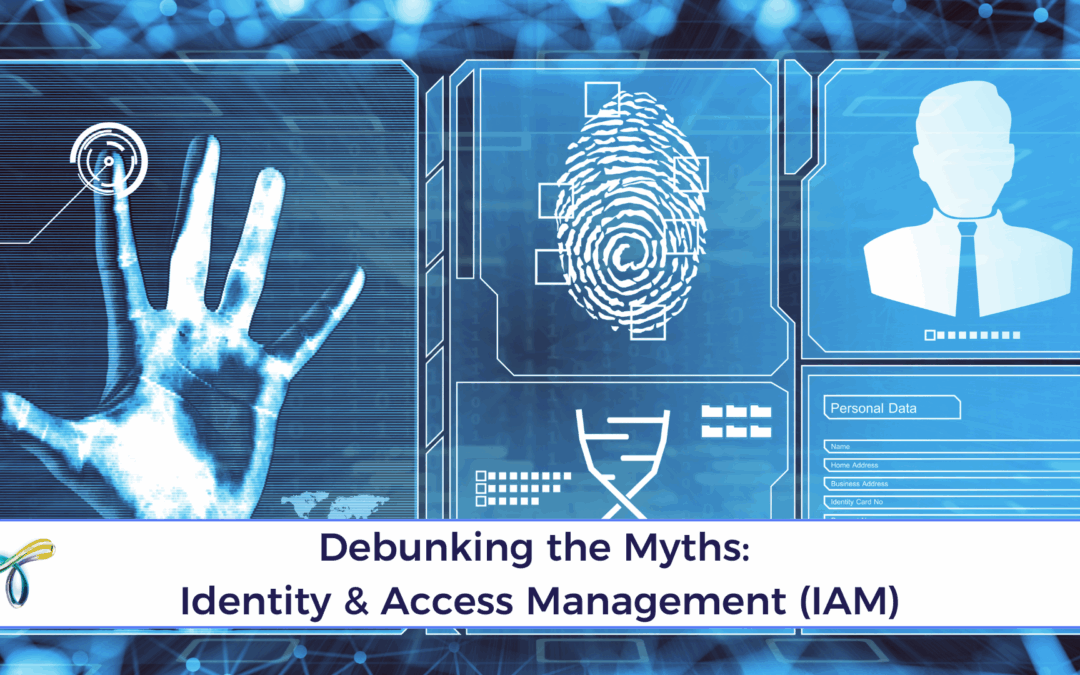
Debunking the Myths: Identity & Access Management (IAM)
IAM Isn't Just for the IT Crowd Anymore Identity & Access Management (IAM) has a reputation. For many, it still sounds like something buried...

Accelerating Digital Payments in Logistics with Mendix: The Roadcard Story
From Legacy to Leadership: Roadcard’s Digital Evolution In the ever-moving world of logistics, timing is everything. Roadcard, a leading Brazilian...


